![Mapping the Bearish Continuation in NQ & ES [June 8 - 12, 2026]](https://res.cloudinary.com/dcvlg4856/image/upload/v1780846230/analysis/e157dafb86a2c898.jpg)
June 7, 2026 · 3 min read
After a volatile close to the week, the charts have left behind clear institutional footprints. For those of us trading the Micro E-mini Nasdaq-100 (MNQ) and S&P 500 (MES) going into this week, the narrative is pointing heavily toward a bearish continuation.
However, as ICT traders know, we don’t chase price, we wait for price to come to us. Here is the breakdown of the setup we are stalking, utilizing SMT Divergence, classic premium arrays, and precise Standard Deviation projections to map our ultimate downside targets.
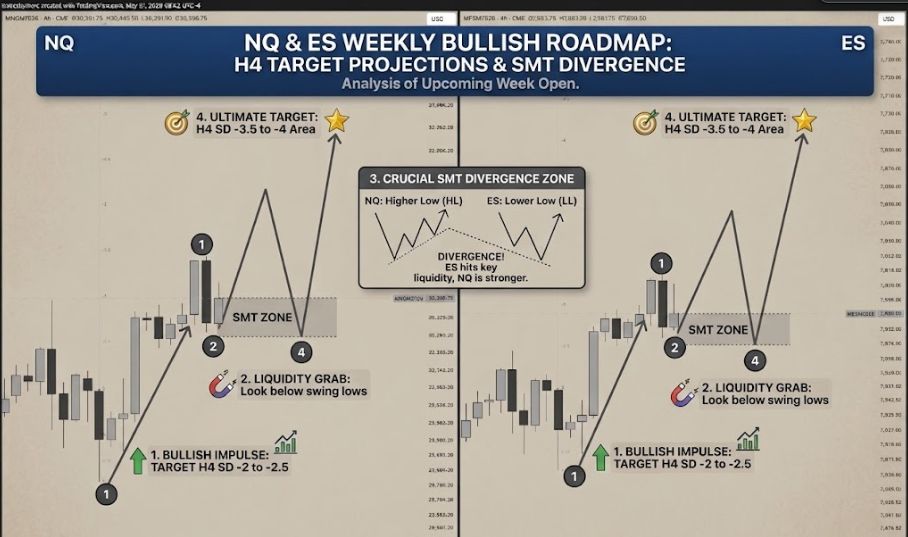
Before the aggressive sell-off, the early warning sign was printed right at the top. We had a clear SMT Divergence between NQ and ES.
While one index pushed to sweep liquidity, the other failed to make a confirming high, signaling a classic crack in correlation. This SMT was the first indication that Smart Money was accumulating short positions and capping the upside.
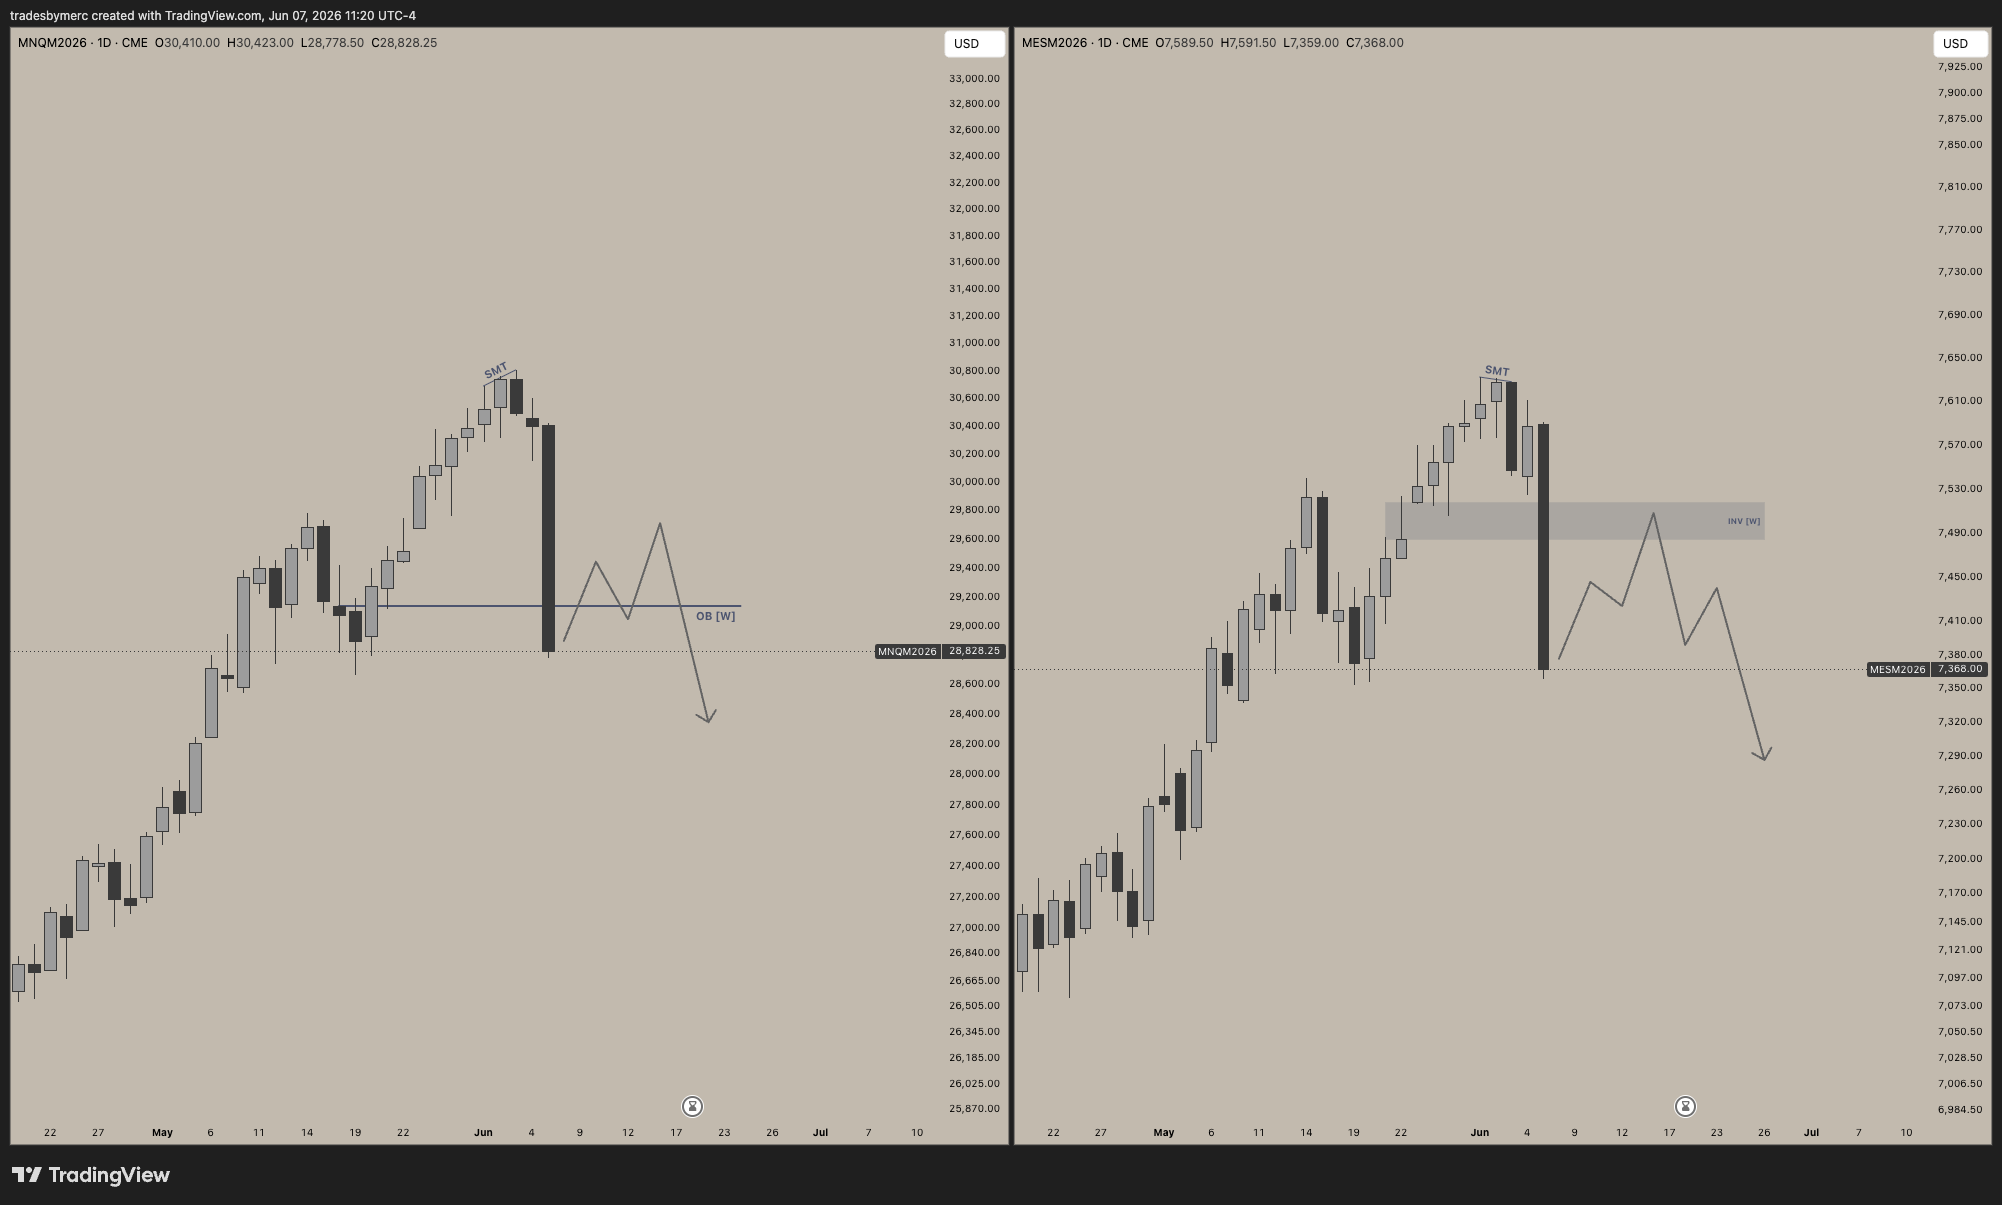
Following the SMT, the market violently repriced. We saw massive bearish displacement, printing aggressive down-close candles that broke through short-term swing lows. The displacement has left behind clear imbalances and order blocks, giving us the framework for this week's playbook.
Looking at the daily charts, the expectation for this week is a systematic retracement back up into a premium array before the next major leg down.
MNQ (Nasdaq): We are tracking a retracement back up into the Weekly Order Block (OB [W]). The goal is to see price rally into this zone, respect the threshold, and provide a lower-timeframe bearish shift.
MES (S&P 500): The draw for the retracement is the Weekly Inversion/Fair Value Gap (INV [W]). If price trades up into this grey box and rejects, it confirms our bearish bias.
By anchoring to the initial manipulation leg following our SMT top, we can project exactly where algorithmic delivery is likely to take price. As you can see mapped out on both charts, we are targeting two specific confluence zones for our take-profits:
Target 1: The -2 to -2.5 Standard Deviation Zone. This is our primary area of interest for partials or the initial completion of the measured move.
Target 2: The -3.5 to -4 Standard Deviation Zone. If the bearish momentum sustains and we see heavier sell-side delivery, this deeper projection zone acts as the ultimate macro draw on liquidity.
The Takeaway: Let the market breathe this week. Allow the retracement into premium pricing to unfold, and look for your lower-timeframe execution models once we tap those weekly arrays. The downside targets are clearly defined—now it's just about executing the plan.
Disclaimer: This post is for educational purposes only and does not constitute financial advice. Always manage your risk.
--- Merc [Carlo]
NQ and ES May 25 - 29, 2026 Outlook
May 24, 2026 · 1 min read
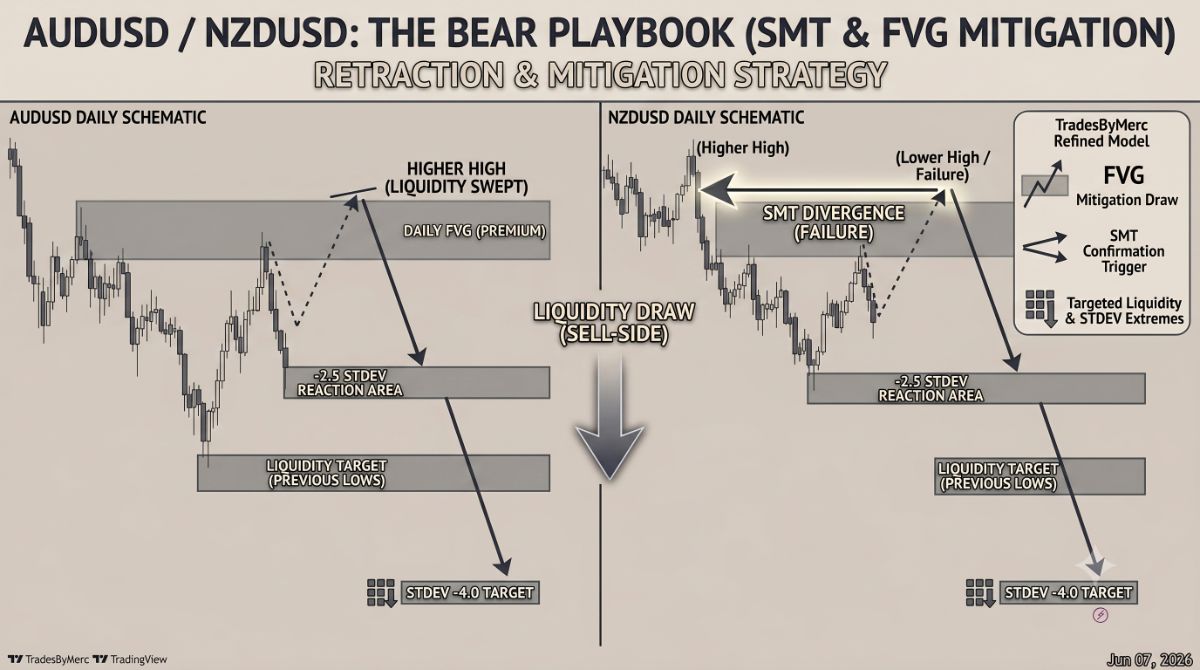
Stalking the Judas Swing in Aussie & Kiwi – The Bearish Path
Jun 8, 2026