October 15, 2026 · 2 min read
📊 NASDAQ Trade Analysis
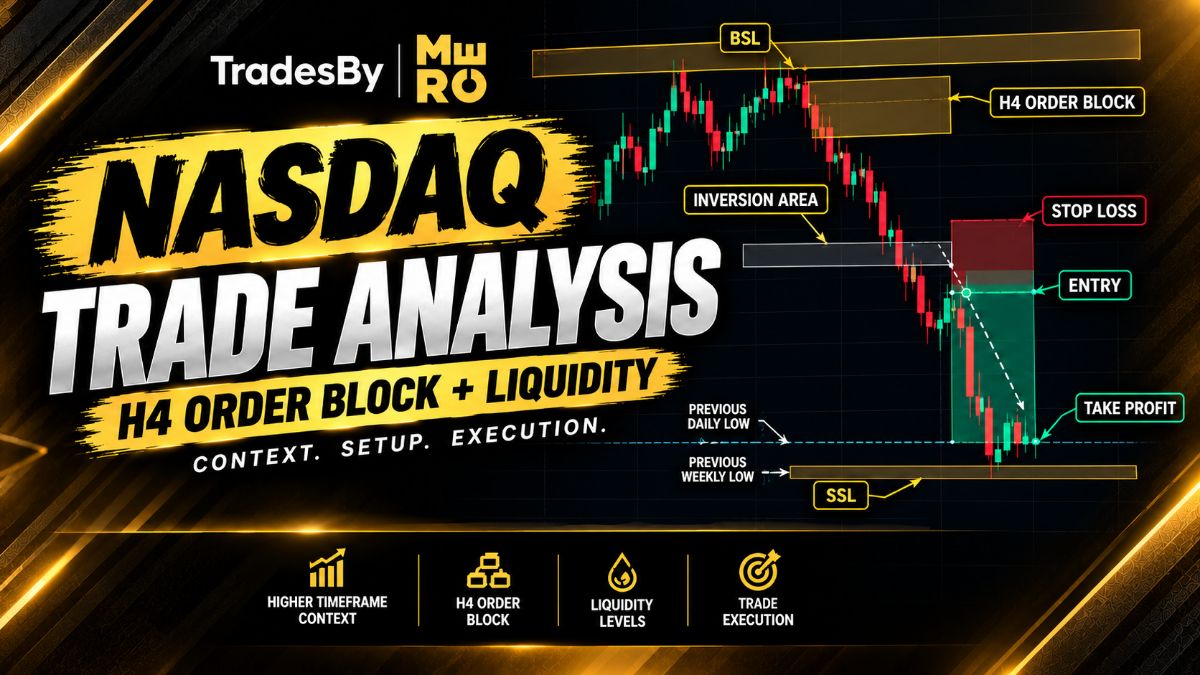
This NASDAQ setup is reviewed based on the chart shown in the video. The analysis below is limited to the visible price action and chart annotations. No unverified entry logic, confluences, or trade results have been added.
The chart shows a bearish price movement followed by a reaction in the opposite direction.
This provides a starting point for examining the trade structure. However, the broader higher-timeframe trend and the specific timeframe used for the setup need to be confirmed before drawing stronger conclusions.
A short-position tool is visible on the chart, with the risk area positioned above the entry region and the target area extending below it.
This indicates that the displayed setup is structured around a potential downward price move.
However, the exact entry price, stop-loss, take-profit, and risk-to-reward ratio cannot be stated reliably without clearly readable chart values or trade history.
The video shows price moving downward before subsequently rebounding.
This price reaction is important when reviewing the setup because a bearish move does not guarantee continued downside delivery.
To assess the trade accurately, we would need to establish where the short entry occurred relative to the price movement and whether the marked target or stop-loss was reached.
Based on the visible chart, the setup can be summarized as:
NASDAQ price action
↓
Short-position setup marked on the chart
↓
Downward price movement
↓
Subsequent upward reaction
This sequence describes the visible movement without assuming an unconfirmed order block, liquidity sweep, market structure shift, or other trading confluence.
A trade should be evaluated using both its setup and its actual outcome.
Identifying a potential bearish move is only one part of the process. Entry confirmation, risk management, invalidation, and the final exit all matter when determining whether a trade was executed according to plan.
For the TradesByMerc community, the goal is not simply to label a setup as successful or unsuccessful. It is to understand the evidence behind the decision and distinguish what the chart actually shows from what the trader might infer.
Read the context. Define the risk. Verify the execution.
For educational purposes only. This analysis is limited to the visible information in the recording and is not a live trading signal or guarantee of profit. Trading involves risk.
Log in to like and join the discussion.
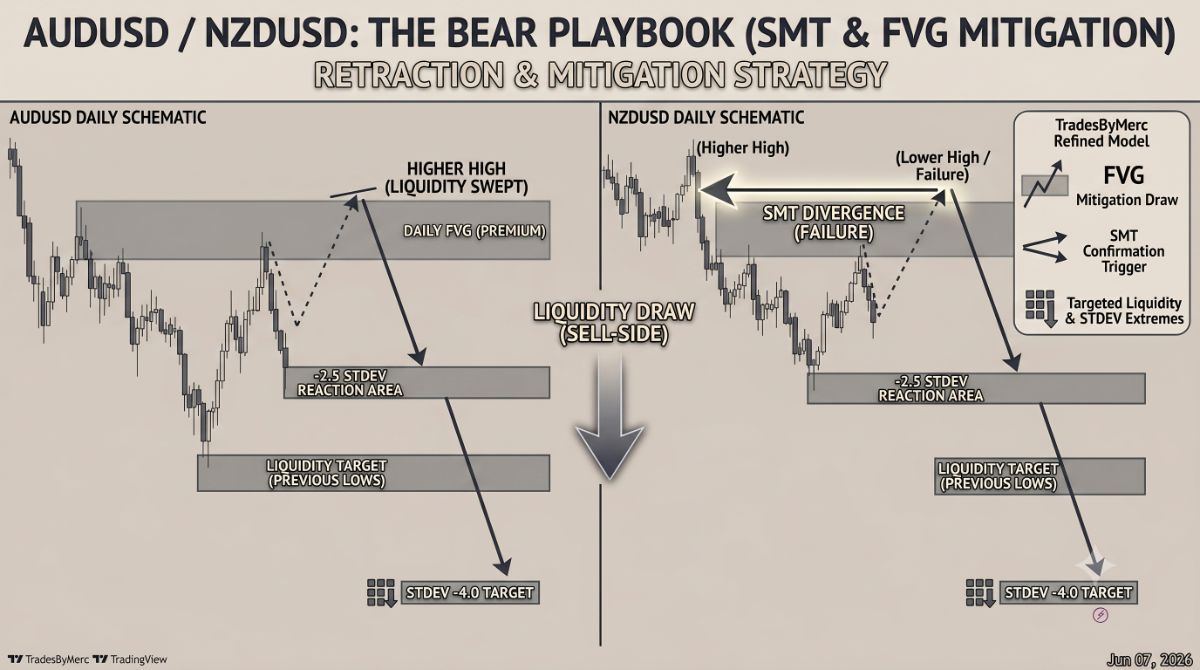
Stalking the Judas Swing in Aussie & Kiwi – The Bearish Path
Jun 8, 2026
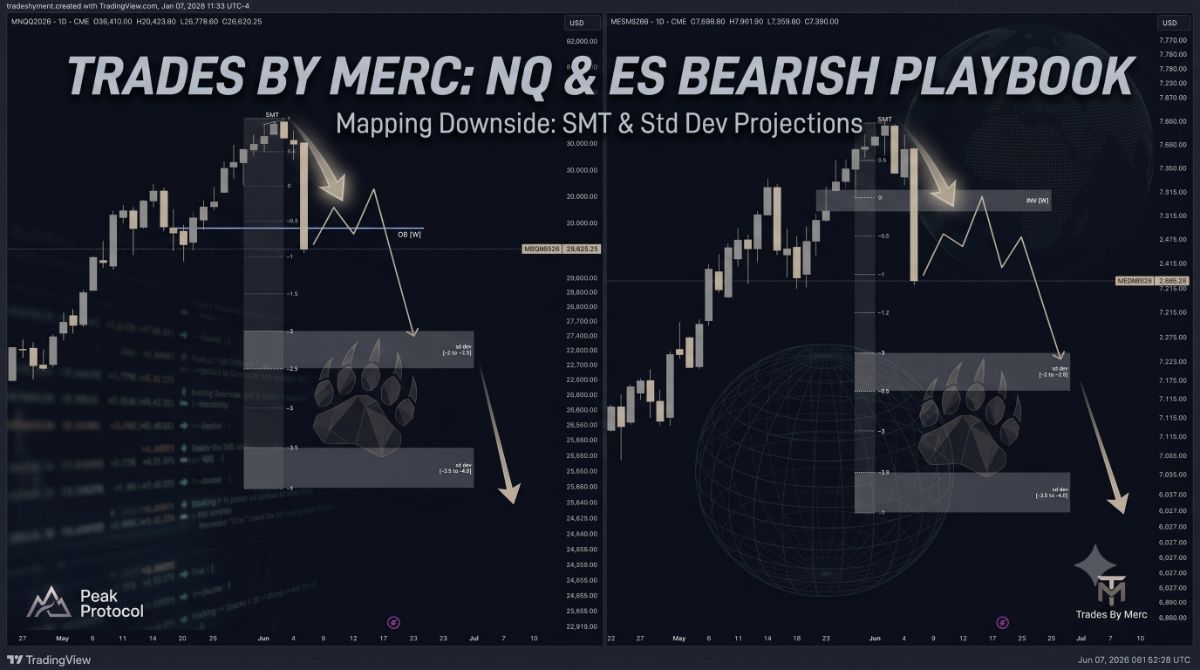
Mapping the Bearish Continuation in NQ & ES [June 8 - 12, 2026]
Jun 7, 2026
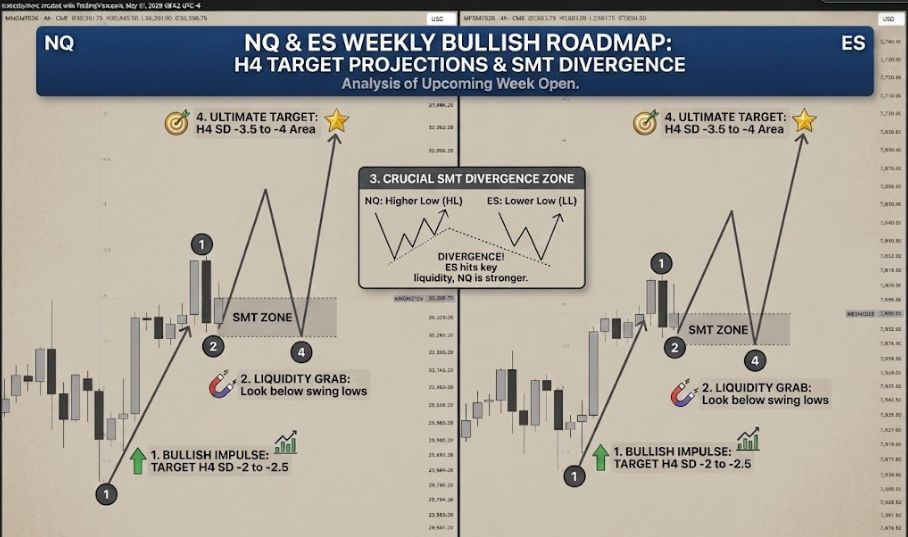
NQ & ES Weekly Bullish Roadmap
May 31, 2026
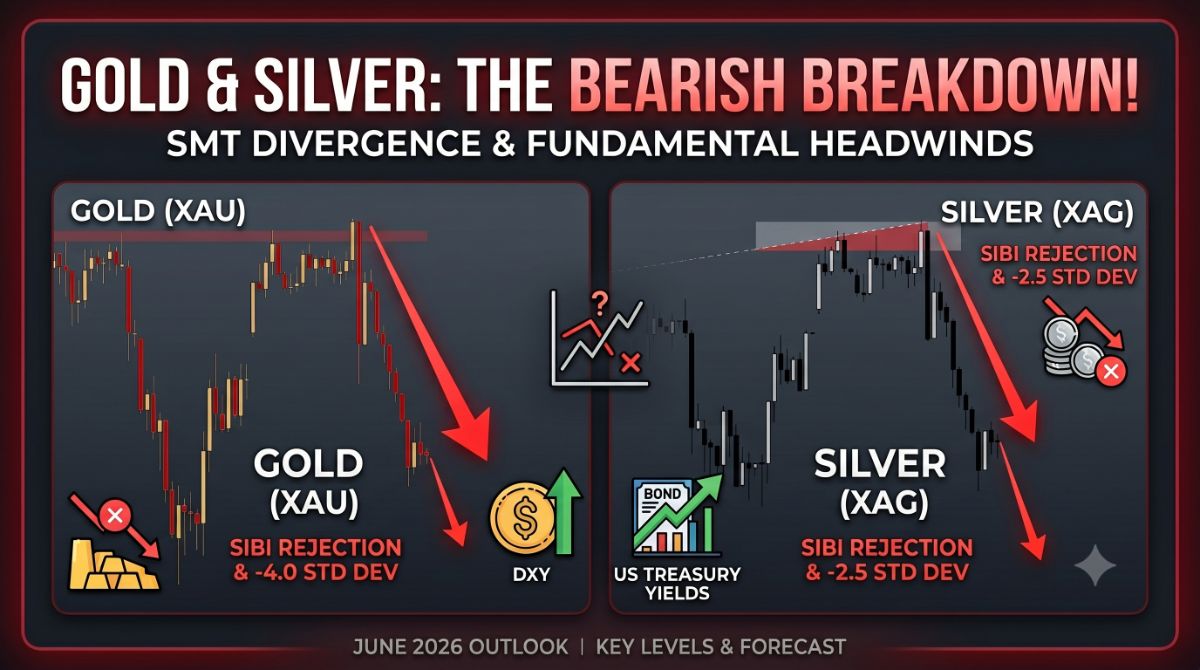
Gold & Silver Market Outlook: SMT Divergence & The Bearish Case
Jun 21, 2026
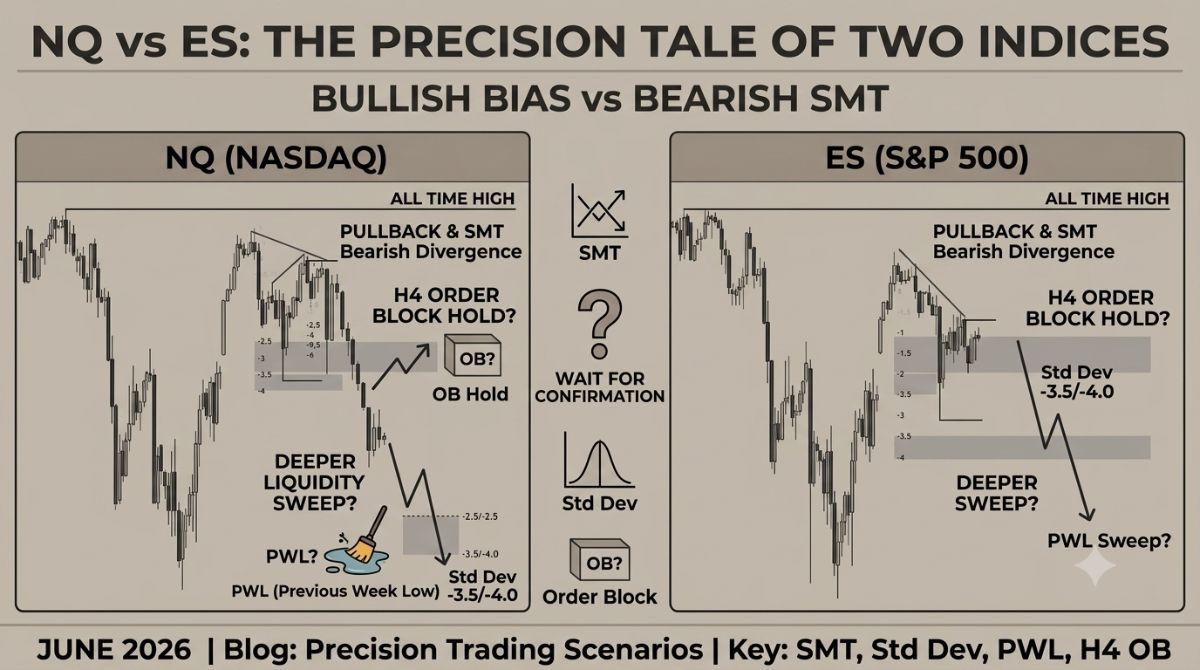
Nasdaq (NQ) vs S&P500 (ES): Precision Scenarios in a Tale of Two Indices
Jun 21, 2026