June 28, 2026 · 3 min read
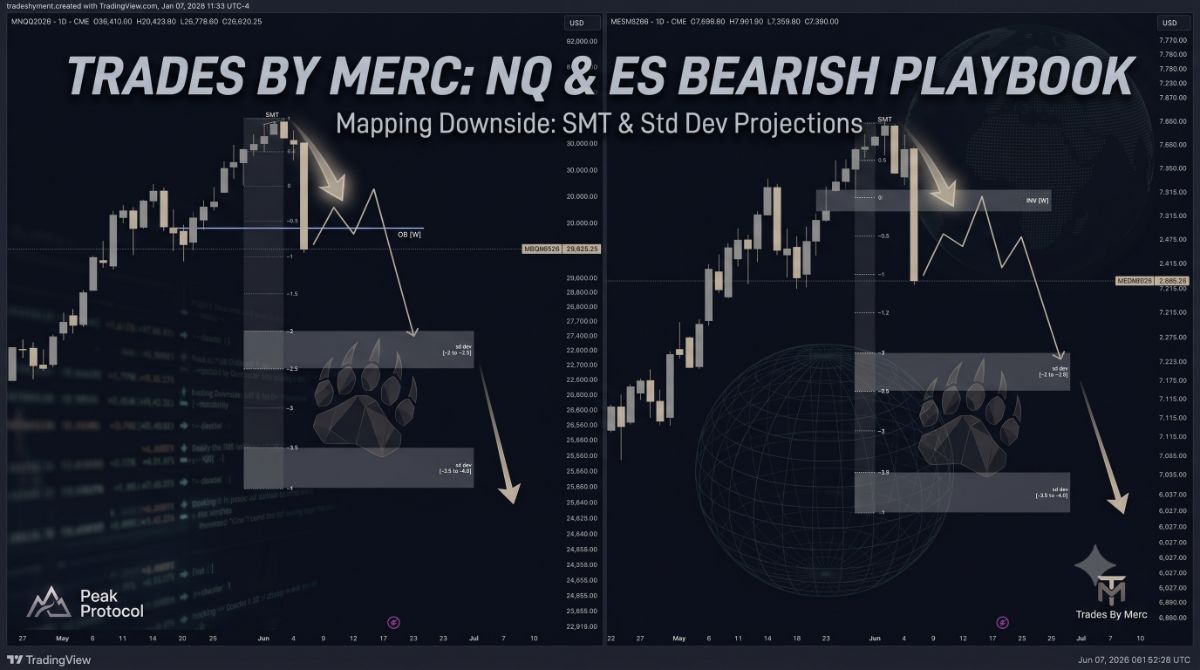
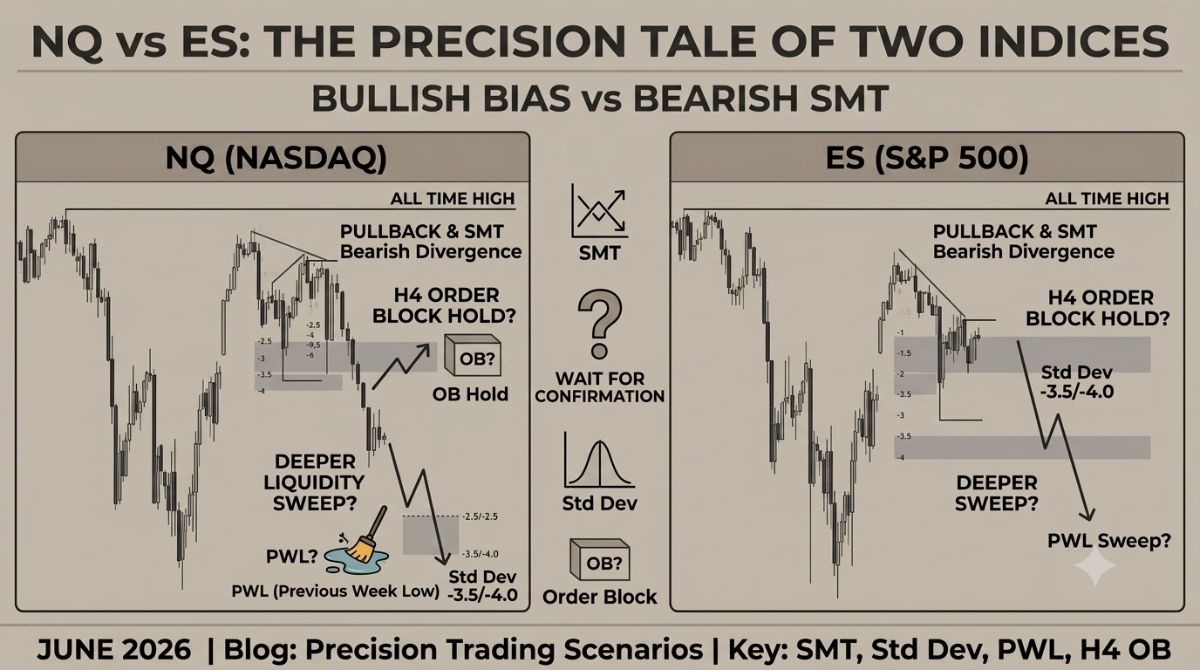
As we head into the final days of June and prepare for a new trading week, the technical footprint for the major US indices is clear. Both the Nasdaq 100 (NQ) and the S&P 500 (ES) are flashing strong signals that last week's downward momentum is poised to continue.
If you are tracking institutional order flow, the charts have laid out a textbook bearish narrative. Here is a breakdown of why our outlook remains heavily tilted to the downside, and the specific targets we are watching.
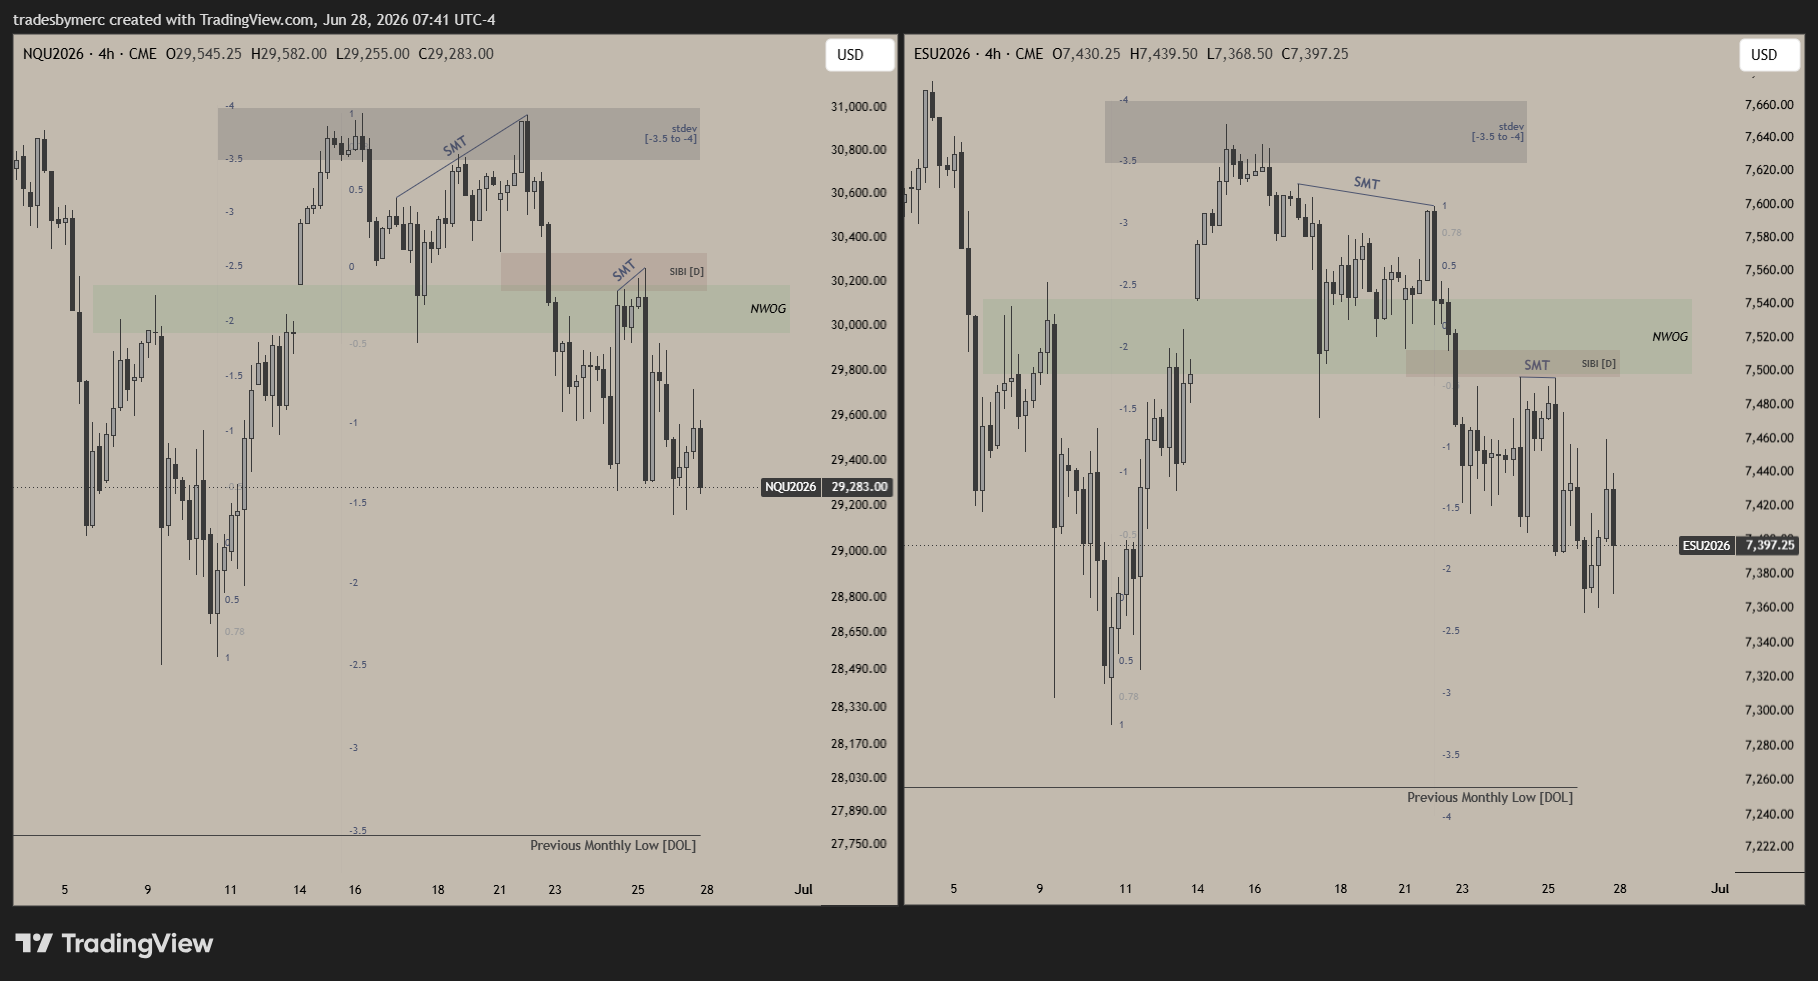
Last week gave us all the confirmation we needed to solidify a bearish bias. The most telling clue was the New Week Opening Gap (NWOG). Instead of acting as support, price sliced through it and treated it as an inversion gap, keeping prices suppressed and confirming that sellers are dominating the current delivery cycle.
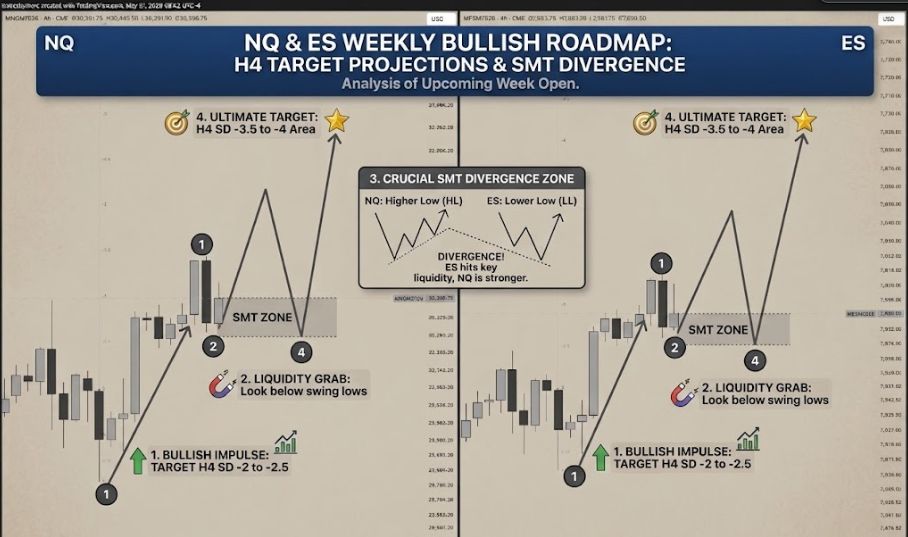
Furthermore, when we measure the structural range from the lowest low on the 4-hour (H4) timeframe, the recent push to the highs tapped perfectly into our algorithmic reversal zone. This exhaustion at the highs was confirmed by a macro SMT Divergence between NQ and ES, signaling that the smart money was distributing positions rather than buying the breakout.
When we zoom into the most recent daily price action, we get our immediate catalyst for the week ahead.
Last week's price action created a fresh daily Fair Value Gap (SIBI). This is where things get interesting:
Nasdaq (NQ) traded aggressively higher, sweeping the liquidity above and taking out this daily FVG.
S&P 500 (ES), however, showed massive relative weakness. It failed to reach its respective FVG, leaving that high intact.
This creates a beautiful, localized SMT Divergence right at a premium array. When one index sweeps a high while the sister index fails to follow, it is a classic hallmark of algorithmic trapping and a massive red flag for any remaining bulls.
With the highs confirmed as distribution zones, we have to ask: Where is price being drawn to next?
Our primary Draw on Liquidity (DOL) for both NQ and ES is the Previous Monthly Low. What makes this target incredibly high-probability is the technical confluence. This massive pool of sell-side liquidity lines up almost perfectly with our standard deviation -3.5 to -4 algorithmic projection area. When a major liquidity pool aligns with a deep standard deviation target, price acts like a magnet seeking that specific level.
From a fundamental perspective, this bearish technical setup makes perfect sense. The broader equity markets are facing headwinds from persistently high bond yields and shifting expectations regarding the Federal Reserve's rate-cut timeline.
Additionally, we are seeing signs of capital rotation. As investors lock in profits from the heavily weighted, mega-cap tech stocks that have carried the indices all year, the Nasdaq naturally feels the heaviest downward pressure. This tech-sector vulnerability perfectly aligns with our charts, providing the fundamental fuel needed to push price down toward our monthly liquidity targets.
For the coming week, the trend is your friend. We are trusting the SMT divergence at the highs and the inversion of the NWOG. Look for premium arrays and lower-timeframe retracements to fail, offering potential opportunities to ride the momentum down to the Previous Monthly Low.
Disclaimer: This article is for educational purposes only and does not constitute financial advice. Always do your own research and manage your risk appropriately.
Log in to like and join the discussion.
GOLD Long Trade Analysis | SMT + Order Block + BSL
Oct 10, 2026 · 3 min read
Stalking the Judas Swing in Aussie & Kiwi – The Bearish Path
Jun 8, 2026