June 28, 2026 · 3 min read
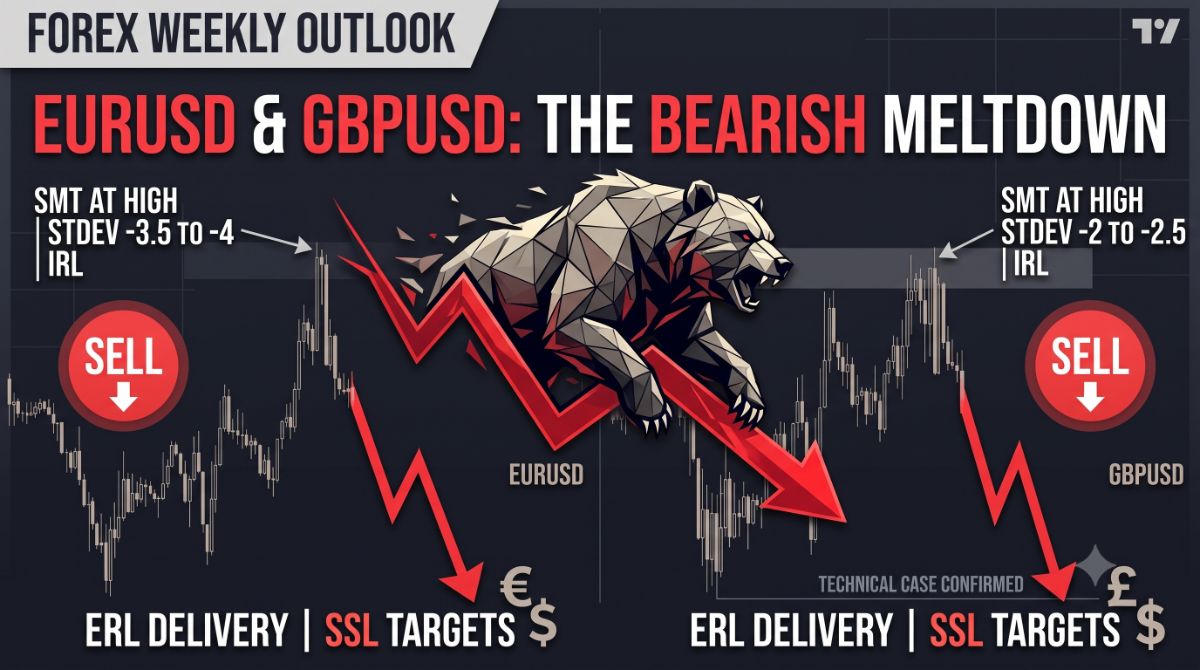
As we head into the new trading week, the charts are painting a clear picture for the Euro and the British Pound against the US Dollar: the bears are in control.
If you've been watching the price action closely, multiple technical signals are aligning to suggest further downside for both EURUSD and GBPUSD. Here is a breakdown of what the charts are telling us and why our outlook remains heavily bearish.
Before diving into the smaller details, it is vital to zoom out. On the higher timeframes, both the Euro and the Pound are firmly locked in a downtrend.
Currently, we are observing a classic Internal Range Liquidity (IRL) to External Range Liquidity (ERL) delivery on the daily charts. In simple terms, price recently pulled back into internal zones of resistance (like daily order blocks and fair value gaps) to gather orders. Now that those areas have been tapped, the algorithm is pricing lower, seeking out external liquidity—specifically, the old lows sitting below the current market price (Sell-Side Liquidity).
When we drop down to the lower timeframes, the signals confirming this downward push become incredibly clear. The recent highs gave us two massive clues that a Market Maker Sell Model (MMSM) is nearing completion.
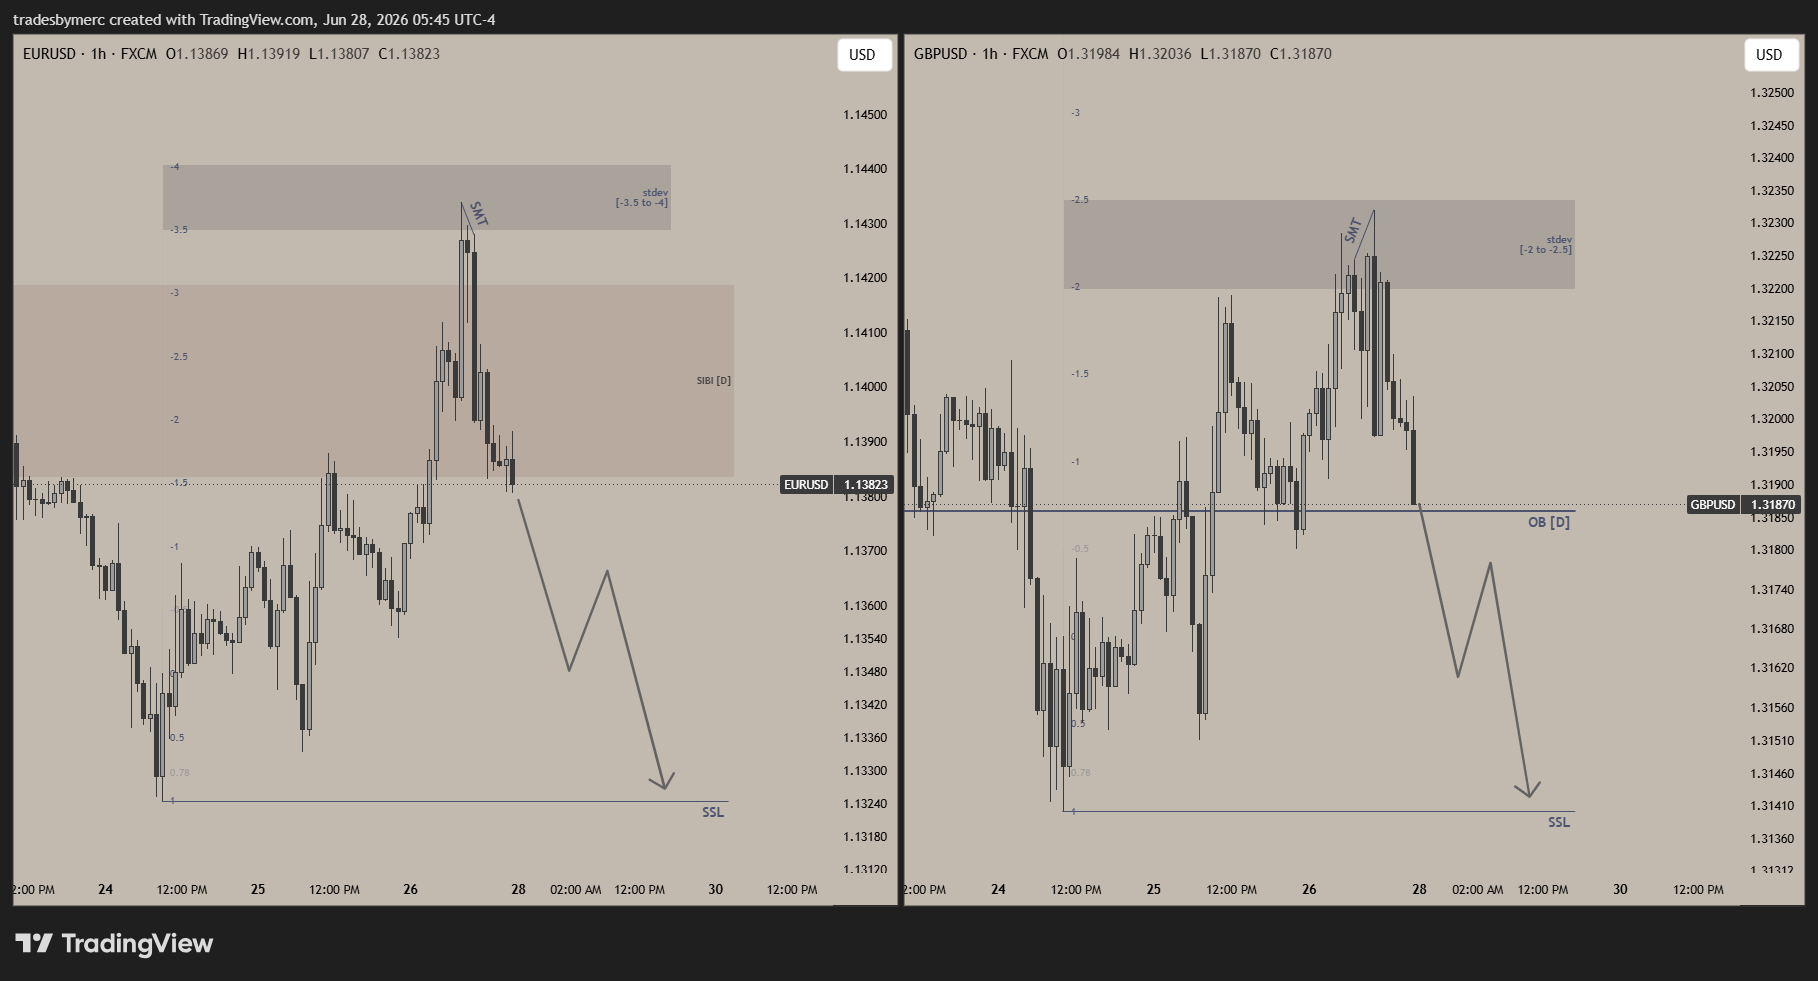
1. SMT Divergence at the Highs At the recent peak, we saw a clear Smart Money Technique (SMT) divergence between EURUSD and GBPUSD. For a healthy uptrend, both pairs should ideally mirror each other, making higher highs together. Instead, we saw a crack in correlation at the highs. One pair failed to push higher while the other did, signaling underlying weakness and a classic hallmark of institutional distribution.
2. Standard Deviation Targets Hit Furthermore, algorithmic standard deviation (STDEV) targets perfectly caught the reversal.
EURUSD exhausted its upward push right at the -3.5 to -4 standard deviation zone.
GBPUSD found its ceiling perfectly within the -2 to -2.5 standard deviation zone.
Hitting these specific algorithmic extremes tells us that the temporary upward cycle has finished its job. The market was brought up strictly to trap buyers and rebalance old price action before aggressively reversing back in the direction of the higher timeframe trend.
While the charts give us the "when" and "where," the fundamentals give us the "why." The bearish technicals for EUR and GBP align perfectly with a fundamentally strong US Dollar. Persistent, sticky inflation data out of the US and resilient economic performance continue to keep the Federal Reserve's interest rates elevated.
Meanwhile, economic sluggishness in the Eurozone and the UK makes it difficult for the ECB and BOE to maintain aggressive, hawkish stances compared to the Fed. As long as the yield advantage and safe-haven demand favor the Greenback, the path of least resistance for both EURUSD and GBPUSD remains down.
For the coming week, the objective is straightforward: follow the institutional order flow. With SMT divergence confirming the highs, standard deviation targets perfectly predicting the exhaustion, and a daily IRL-to-ERL narrative in play, we are looking for price to continue melting down toward those Sell-Side Liquidity targets.
Stay patient, wait for your lower-timeframe entry models, and let the larger trend do the heavy lifting.
Disclaimer: This article is for educational purposes only and does not constitute financial advice. Always do your own research and manage your risk appropriately.
Log in to like and join the discussion.
GOLD Long Trade Analysis | SMT + Order Block + BSL
Oct 10, 2026 · 3 min read
Stalking the Judas Swing in Aussie & Kiwi – The Bearish Path
Jun 8, 2026